June 13, 2014
By: TOP500 Team
Gary M. Johnson, Computational Science Solutions
Since June of 1993, the Top500 List has been presenting information on the world’s 500 most powerful computer systems. The statistics about these systems have proven to be of substantial interest to computer manufacturers, users and funding authorities. While interest in the list is focused on the computers, less attention is paid to the countries hosting them. Let’s take a look at the Top500 List countries. Who are they? How might one characterize them?
So far, there have been 42 editions of the Top500 List. Over those editions, a total of 58 countries have appeared on the list:
Australia, Austria, Belarus, Belgium, Brazil, Bulgaria, Canada, China, Colombia, Cyprus, Czech Republic, Denmark, Egypt, Finland, France, Germany, Greece, Hong Kong, Hungary, India, Indonesia, Ireland, Israel, Italy, Japan, South Korea, Liechtenstein, Luxembourg, Malaysia, Mexico, Netherlands, New Zealand, Nigeria, Norway, Oman, Peru, Philippines, Poland, Portugal, Puerto Rico, Qatar, Russia, Saudi Arabia, Singapore, Slovak Republic, Slovenia, South Africa, Spain, Sweden, Switzerland, Taiwan, Thailand, Turkey, United Arab Emirates, United Kingdom, United States, Venezuela, Vietnam
Depending on how one counts, there are somewhere between 191 and 260 “countries” in the world. So, the list of those that at one time or another chose to join the list is in the range of 22% to 30% of total countries.
Before we take a closer look at the current situation, let’s review some of the historical data. Between June 1993 and November 2013, the number of countries on the Top500 List has varied from a low of 21 in November 1998 and June 1999 to a high of 39 in November 2003. The average number is 28, which also happens to be the current number.
Nine of the 58 Top500 List countries have only appeared in one edition:
Colombia (June 2004), Cyprus (June 2008), Hungary (November 2000), Nigeria (June 2002), Peru (June 2000), Philippines (June 2007), Puerto Rico (November 2001), Qatar (June 2004), Vietnam (June 2007)
We note that summer is the season of choice for the one-timers.
Ten countries have appeared in every edition, so let’s call them theTop500 Stalwarts:
Australia (AU), Canada (CA), France (FR), Germany (DE), Italy (IT), Japan (JP), Sweden (SE), Switzerland (CH), United Kingdom (GB), United States (US)
Of the remaining 39 countries, 20 have appeared more than half the time. Of those 19 with good but not perfect attendance, 11 countries have appeared more than about 75% of the time. We’ll call them theTop500 Enthusiasts:
Belgium (BE), Brazil (BR), China (CN), Denmark (DK), Finland (FI), South Korea (KR), Netherlands (NL), Norway (NO), Saudi Arabia (SA), Spain (ES), Taiwan (TW)
Note that China, currently occupying the top spot on the list, and Saudi Arabia would just miss the Enthusiast category by each coming in at 74% attendance - but we’ve included them anyway. This makes the point that these divisions are a bit arbitrary.
While citing caveats, we should also mention that, since the Top500 List is a collection of volunteered information, it neither is nor pretends to be comprehensive. For various reasons, sites may choose not to participate. So, the kind of analysis we’re doing here has its limitations.
For future reference, we’ll call the combined grouping of Stalwarts and Enthusiasts the Top500 Players.
Now let’s take a closer look at these groupings. Who are the countries in them? What are some of the group attributes?
Below are a couple of tables, showing how the Stalwarts and the Enthusiasts rank on several indexes: GDP, GDP per capita, Global Competitiveness, Global Innovation, Knowledge Economy, and Prosperity. Ranking high on these indexes is something to which most countries aspire. Also, we like to think of supercomputing as a tool for improving economies, adding to knowledge and increasing prosperity.
|
Index/Rank |
Top500 Stalwarts |
AVG |
|||||||||
|
AU |
CA |
FR |
DE |
IT |
JP |
SE |
CH |
GB |
US |
||
|
GDP |
17 |
13 |
9 |
5 |
11 |
4 |
33 |
37 |
8 |
1 |
14 |
|
GDP per capita |
20 |
24 |
37 |
26 |
45 |
36 |
22 |
14 |
33 |
12 |
27 |
|
Global Competitiveness |
21 |
14 |
23 |
4 |
49 |
9 |
6 |
1 |
10 |
5 |
14 |
|
Global Innovation |
19 |
11 |
20 |
15 |
29 |
22 |
2 |
1 |
3 |
5 |
13 |
|
Knowledge Economy |
9 |
7 |
24 |
8 |
30 |
22 |
1 |
10 |
14 |
12 |
14 |
|
Prosperity |
7 |
3 |
20 |
14 |
32 |
21 |
4 |
2 |
16 |
11 |
13 |
|
Average over Index Averages |
16 |
||||||||||
|
Index/Rank |
Top500 Enthusiasts |
AVG |
||||||||||
|
BE |
BR |
CN |
DK |
FI |
KR |
NL |
NO |
SA |
ES |
TW |
||
|
GDP |
32 |
7 |
2 |
53 |
56 |
12 |
23 |
46 |
18 |
14 |
20 |
26 |
|
GDP per capita |
29 |
103 |
120 |
30 |
34 |
40 |
21 |
9 |
54 |
44 |
27 |
47 |
|
Global Competitiveness |
17 |
56 |
29 |
15 |
3 |
25 |
8 |
11 |
20 |
35 |
12 |
21 |
|
Global Innovation |
21 |
64 |
35 |
9 |
6 |
18 |
4 |
16 |
42 |
26 |
N/A |
24 |
|
Knowledge Economy |
15 |
60 |
84 |
3 |
2 |
29 |
4 |
5 |
50 |
21 |
13 |
26 |
|
Prosperity |
17 |
46 |
51 |
6 |
8 |
26 |
9 |
1 |
50 |
23 |
22 |
24 |
|
Average over Index Averages |
28 |
|||||||||||
On average, the countries in both groups rank highly against world norms. However, by these measures, the Stalwarts do almost twice as well as the Enthusiasts.
Seven of the Group of Eight (G8) leading industrialized countries – all except Russia – are among the Stalwarts. Half of the Stalwarts and 5 of the 11 Enthusiasts are European Union member countries. Six of the Stalwarts and six of the Enthusiasts are members of the Partnership for Advanced Computing in Europe (PRACE). So, 10 of the 28 EU member countries and 12 of 25 PRACE members are among the Top500 Players.
If we use the number of Science Nobel Laureates claimed by the countries in each of the groups as a measure, then as of 2010 the Stalwarts had accumulated 627 versus the Enthusiasts who had only 50. Together, the vast majority of Nobel Laureates in science are claimed by the Top500 Players.
Since we often compare supercomputing to Formula 1 racing, let’s take a look at the number of Formula 1 wins racked up by each of the groups during the period from 1950 through 2013. The Stalwarts have 39 and the Enthusiasts only 14. But, together as the Players, they account for 83% of all wins.
If we switch from automobile racing back to computer racing and take a look at some data from the November 2013 Top500 List, here’s how things stand:
|
Country |
Top500 Stalwarts |
|||||
|
Number of Systems |
Sum of Rmax (TF) |
Sum of Rmax (% of List Total) |
Average System Size (TF) |
GF/(GDP Billion) |
MF per capita |
|
|
Australia (AU) |
5 |
2,180 |
0.87% |
436 |
2,184 |
97 |
|
Canada (CA) |
10 |
2,078 |
0.83% |
208 |
1,369 |
60 |
|
France (FR) |
22 |
9,490 |
3.79% |
431 |
4,175 |
143 |
|
Germany (DE) |
20 |
13,697 |
5.48% |
685 |
4,244 |
169 |
|
Italy (IT) |
5 |
2,666 |
1.07% |
533 |
1,477 |
43 |
|
Japan (JP) |
28 |
22,472 |
8.99% |
803 |
4,752 |
177 |
|
Sweden (SE) |
5 |
1,068 |
0.43% |
214 |
2,711 |
110 |
|
Switzerland (CH) |
5 |
7,765 |
3.11% |
1,553 |
20,971 |
963 |
|
United Kingdom (GB) |
23 |
9,058 |
3.62% |
394 |
3,809 |
142 |
|
United States (US) |
264 |
118,262 |
47.29% |
448 |
7,073 |
371 |
|
Averages |
39 |
18,874 |
7.55% |
570 |
5,277 |
227 |
|
Country |
Top500 Enthusiasts |
|||||
|
Number of Systems |
Sum of Rmax (TF) |
Sum of Rmax (% of List Total) |
Average System Size (TF) |
GF/(GDP Billion) |
MF per capita |
|
|
Belgium (BE) |
1 |
152 |
0.06% |
152 |
361 |
15 |
|
Brazil (BR) |
3 |
626 |
0.25% |
209 |
258 |
3 |
|
China (CN) |
63 |
48,549 |
19.41% |
771 |
3,631 |
36 |
|
Denmark (DK) |
1 |
162 |
0.06% |
162 |
767 |
29 |
|
Finland (FI) |
2 |
378 |
0.15% |
189 |
1,934 |
72 |
|
Korea, South (KR) |
5 |
1,258 |
0.50% |
252 |
755 |
26 |
|
Netherlands (NL) |
3 |
511 |
0.20% |
170 |
734 |
30 |
|
Norway (NO) |
3 |
735 |
0.29% |
245 |
2,606 |
143 |
|
Saudi Arabia (SA) |
3 |
1,165 |
0.47% |
388 |
1,256 |
43 |
|
Spain (ES) |
2 |
1,199 |
0.48% |
600 |
863 |
25 |
|
Taiwan (TW) |
1 |
177 |
0.07% |
177 |
191 |
8 |
|
Averages |
8 |
4,992 |
2.00% |
301 |
1,214 |
39 |
Here again we notice that, as groupings, the Stalwarts outdo the Enthusiasts – but by a considerably wider margin than they did on the previously cited economic measures.
The sum of the Rmax values for all 500 entries in the November 2013 list yields just over 250 Petaflops. Of that total, the Top500 Stalwarts have 75% and the Enthusiasts have 22%. Within the Stalwarts, the US alone has 47% of the list total and within the Enthusiasts China dominates at 19%.
It is also interesting to note that, on a Megaflops per capita basis, the best country in the world – by far – is Switzerland. Switzerland is also ranked first in the world by the Global Competitiveness and Global Innovation indexes.
Having noted the dominance of the US and China, let’s see how the European Union countries on the Top500 List would look, taken as an entity. If we look at the averages over those countries, not surprisingly, they look about the same as or somewhat better than the Top500 Enthusiasts group. But they are pretty distant from the Stalwarts.
|
Country |
Top500 European Union |
|||||
|
Number of Systems |
Sum of Rmax (TF) |
Sum of Rmax (% of List Total) |
Average System Size (TF) |
GF/(GDP Billion) |
MF per capita |
|
|
Austria (AT) |
1 |
153 |
0.06% |
153 |
424 |
19 |
|
Belgium (BE) |
1 |
152 |
0.06% |
152 |
361 |
15 |
|
Denmark (DK) |
1 |
162 |
0.06% |
162 |
767 |
29 |
|
Finland (FI) |
2 |
378 |
0.15% |
189 |
1,934 |
72 |
|
France (FR) |
22 |
9,490 |
3.79% |
431 |
4,175 |
143 |
|
Germany (DE) |
20 |
13,697 |
5.48% |
685 |
4,244 |
169 |
|
Ireland (IE) |
2 |
269 |
0.11% |
134 |
1,411 |
56 |
|
Italy (IT) |
5 |
2,666 |
1.07% |
533 |
1,477 |
43 |
|
Netherlands (NL) |
3 |
511 |
0.20% |
170 |
734 |
30 |
|
Poland (PL) |
2 |
456 |
0.18% |
228 |
560 |
12 |
|
Spain (ES) |
2 |
1,199 |
0.48% |
600 |
863 |
25 |
|
Sweden (SE) |
5 |
1,068 |
0.43% |
214 |
2,711 |
110 |
|
United Kingdom (GB) |
23 |
9,058 |
3.62% |
394 |
3,809 |
142 |
|
Averages |
7 |
3,020 |
1.21% |
311 |
1,805 |
66 |
|
European Union (EU) |
89 |
39,258 |
15.70% |
311 |
2,735 |
94 |
On the other hand, the numbers for an EU entity are quite impressive, sweeping up almost 16% of the list total for Rmax. Viewed from this perspective and as summarized in the table below, three entities dominate world supercomputing: China, the European Union and the United States.
|
Entity |
Top500 World |
|||||
|
Number of Systems |
Sum of Rmax (TF) |
Sum of Rmax (% of List Total) |
Average System Size (TF) |
GF/(GDP Billion) |
MF per capita |
|
|
China (CN) |
63 |
48,549 |
19.41% |
771 |
3,631 |
36 |
|
European Union (EU) |
89 |
39,258 |
15.70% |
311 |
2,735 |
94 |
|
United States (US) |
264 |
118,262 |
47.29% |
448 |
7,073 |
371 |
|
Averages |
139 |
68,690 |
27.47% |
510 |
4,480 |
167 |
|
CN+EU+US |
416 |
206,069 |
82.40% |
510 |
13,439 |
501 |
|
World |
500 |
250,080 |
100.00% |
500 |
3,763 |
63 |
We’ll round out our collection of supercomputing factoids by taking a look at a plot of the Global Innovation Index (GII) country ratings versus their per capita GDPs. This is shown in the following figure, taken from the 2013 edition of the Global Innovation Index Report. Note that country data points are sized by population and that those colored white indicate “efficient innovators” (i.e. those scoring 0.78 or better on the Innovation Efficiency Ratio – see the report of details).
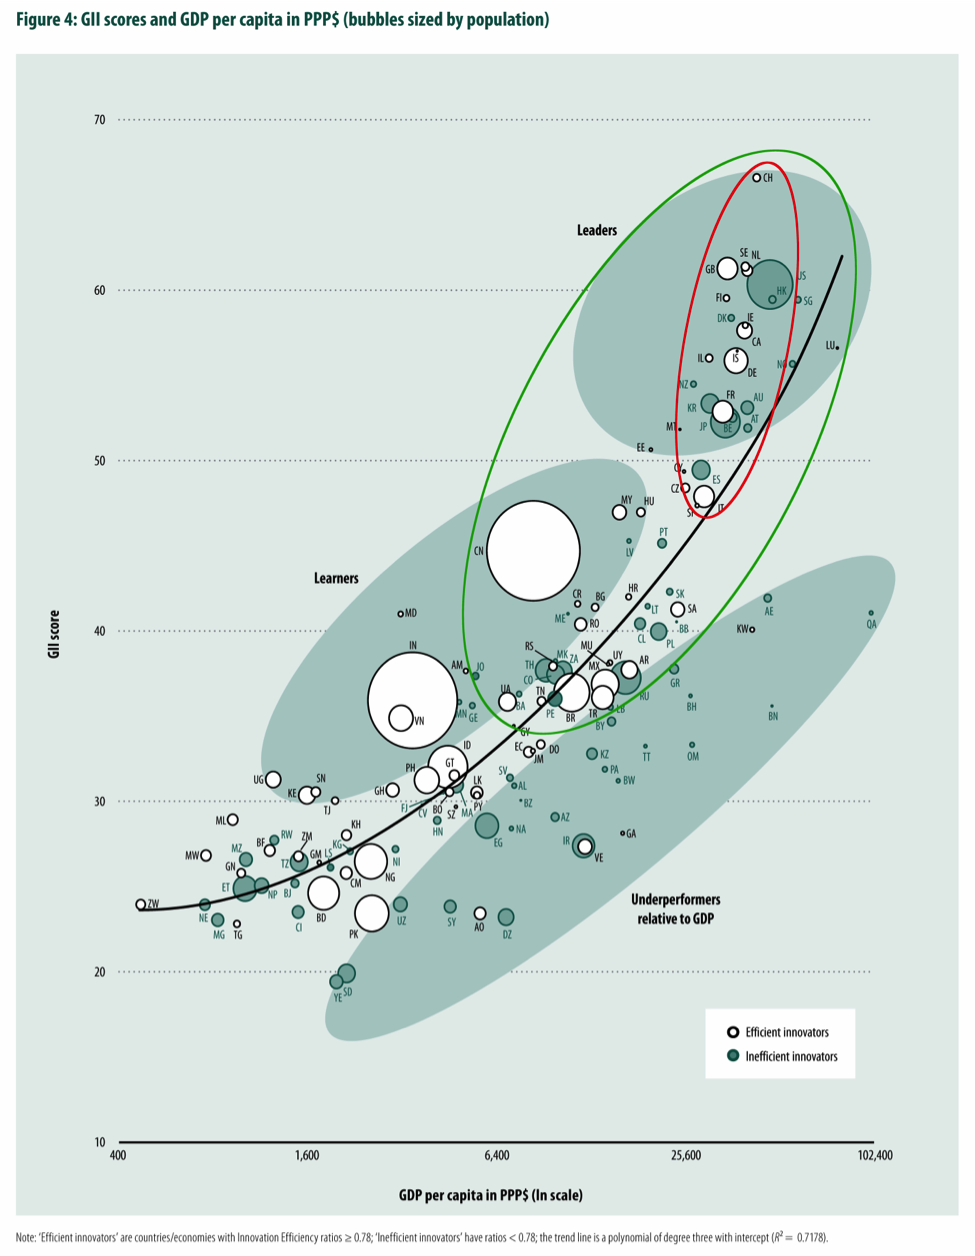
Overlaid on the figure are red and green ellipses, showing the locations of the Top500 Stalwarts and Players, respectively. We see that almost all Stalwarts are innovation leaders and quite a few are also efficient ones. When we expand to the Players, we capture a number of innovation learners and some countries lying under the trend line – but still a pretty good showing.
Overall, our Top500 List countries are quite an impressive bunch.
I wonder what changes the June 2014 list will bring.